
How do you make sense of data that you’ve never seen? This article provides a first-line approach on garnering data insights after the data has been initially retrieved.
Prior to making inferences about data, the data must be examined via a data discovery process. The purpose of this process is to observe anomalies, general tendencies, and form hypotheses. Various data types are considered, such as numerical, categorical, unstructured, and structured data. The data type(s) of relevance in the dataset will dictate how information is summarized and visualized.
Data Types and Measurement
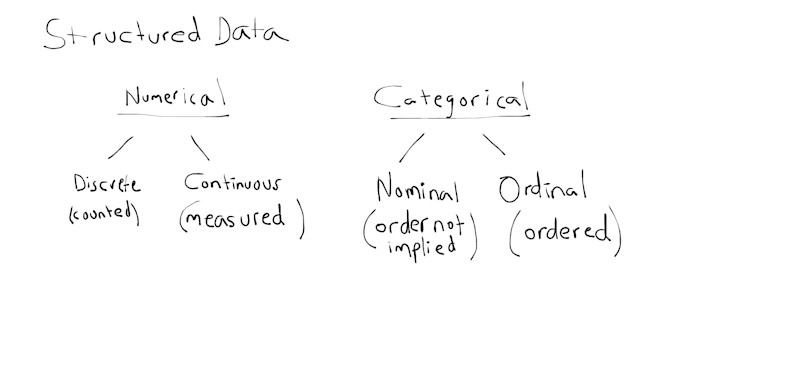

Unstructured data includes images, audio, and text. The measurements for each theme in the analysis can be univariate (one variable), bivariate (two variables), or multivariate (many variables) in nature.
Data Distributions
Histograms are a popular way to visually review numerical data. With histograms, data points are aggregated into bins or ranges. A bar's height indicates the number of data points that fall within the respective bin. Data properties are summarized with regard to segments or bins.
A basic histogram has been produced for a machine tool dataset. The data includes import and export details between 2010-2021 for the HS code assigned “Machine Tools For Working Any Material By Removal Of Material, By Laser/Other Light/Photon Beam, Ultrasonic, Electro-Disch Etc; Water-Jet Cutting Mach.”
The base distribution represents only a portion of this data. It denotes a plot of the average dollar value (a single, continuous variable) associated to the technologies classified under this HS code. The data depicts the distinct number of technologies within this HS code for imports.


From the histogram, a cluster of the data is situated below a $5 million average value. There are a couple of extreme data points to the far right at slightly above a $15 million average value. The distribution appears right skewed since the bin heights decrease heading right.
Zooming in on the histogram where the average value is below $5 million provides further understanding of the distribution. Most technologies in this sample have less than a $2 million average value.


Another representation of this data distribution is shown below. The top 10 technologies (categorical variable) can be visualized by their average value (continuous variable).


Descriptive Statistics
Numerical summaries include common measurements of center (location) and spread (variability). The center of the data distribution can be understood by its mean, median, or mode. For example, the overall mean value for this dataset is about $2.8 million as indicated by the black, dashed line below. Note that since the histogram indicates a skew, it is appropriate to consider the median denoted by the green dashed line. The median is less susceptible to extreme data values.


Spread indicates how dispersed the data is from its mean. Spread is often understood through the variance or standard deviation. A higher variance denotes widely spread data about the mean. Unlike the standard deviation, the scale for variance is in squared units. This makes the standard deviation easier to interpret.
Additional statistical measurements for numerical data points include quartiles and percentiles, maximum, minimum, skewness, correlation, range, and kurtosis among others.
Categorical data is typically described using distinct counts. The relationship between two categorical variables can be seen below where the observations for each combination are counted.


Data Patterns
Relationships about data can be extrapolated based on its history. Here, the average dollar value for a sample of machine tool cutting and forming import categories are plotted across time. Occurrences of sudden peaks for example could prompt questions such as: Which macro or micro level events may have affected imports during a particular time? Do any of the peaks represent an anomaly? What do the relationships across categories imply?


Correlation is commonly used to understand patterns in data and represents the normalized measure to meaningfully review how variables are associated with one another. It provides an objective representation of the relationship between variables. It also provides the direction of the relationship (positive or negative).
Data Wrangling
Coupled with data discovery is data wrangling, also known as data cleaning or munging. This is a necessary process since data quality is often poor. In rare instances when the data is readily usable, the wrangling tasks still remain. Data wrangling involves appropriately structuring and standardizing data as well as enhancing it when applicable. For example, incorporating related public information such as economic indicators can enrich the original data.
Data wrangling may also include performing aggregations, taking meaningful extracts, binning, encoding, or reducing the dimensionality of the data. Aggregations and representative extracts help consolidate information and ease the exploratory process when needed.
Binning and encoding are two types of transformations. Binning converts numerical data points to categorical data points and lends to succinct data evaluation. Encoding transforms categorical data to numerical data, oftentimes in binary form. Other encoding methods beyond basic binary encoding may be performed.
Reducing the dimensionality of the data refers to decreasing the number of variables in the dataset. This is frequently done to aid in data visualization as well as predictive model fitting.
In data discovery, the following steps serve as a first-line approach for making sense of unseen information:
(1) Identifying the data type(s)
(2) Investigating the distribution of the data
(3) Generating a data summary that reveals information about the location of the data and its variability
(4) Evaluating data patterns based on relevant dimensions of the data such as time or categories
(5) Working on data wrangling with respect to the particular objective or use case
Data discovery is an iterative process where questions regarding the data can be answered, and a baseline can be obtained.