Introduction and Objective
This handbook is intended for use by companies that desire to add MTConnect capabilities for positional measures and increased process efficiency. This handbook is an expansion upon work done by previous Virginia Tech design teams. The handbooks are found on the AMT page for Virginia Tech use cases.
The project team simulated a manufacturing environment that would utilize robotic arms for the transportation of materials. The simulation involved changing the position of the gripper of the robotic arm between two designated locations. These locations were determined to simulate moving product from a manufacturing station into shelving for storage. The data collected and visualized via the dashboard allows for process monitoring and understanding machine efficiency.
MTConnect Overview
What is MTConnect?
MTConnect is an open-source standard that serves as a common vocabulary for the manufacturing industry to provide better structured data across all machinery. This allows for users to streamline communication across multiple machines and eliminates the need for specialization on specific machine softwares. MTConnect data provides more efficient operations, improved production optimization, and increased productivity. The standard is also extensible and integrates with other standards due to the need for scalability within system architecture.
Advantages of MTConnect
The overarching purpose of this project is to implement the open-source MTConnect standard with new manufacturing applications. Building upon previous Virginia Tech design teams, this project extends MTConnect to robotic arm applications. MTConnect streamlines the data collection from multiple machines in the Learning Factory to storage in the preferred database platform and ultimately is visualized by an intuitive dashboard. The benefit of MTConnect is the expandability to other data-outputting machines in the factory, including cobots, lathes, and other robotic arms. As the standard is used in more applications, productivity is increased, and operational efficiency is improved for the entire facility.
Equipment
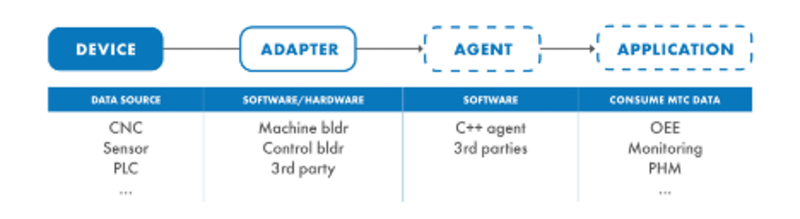
The first step in setting up MTConnect is having a device that is capable of being interfaced with to extract data. This could be any data source from a CNC machine, sensors, PLCs, printers, or other manufacturing machines. Since every piece of equipment is different, it is important to understand how to extract data from the specific machine that is being used. The best place to find information on this is the manufacturer’s documentation on the equipment.
Adapter
The purpose of the adapter is to convert the data from the device into a standard format and pass the data along to the agent. The adapter will look different for every application and changes based on the machine. This piece of equipment is considered optional if the device is already capable of outputting data that the agent can receive. For most applications, the adapter will be needed to convert the data into the correct format. How the adapter connects to the device and what data is extracted is determined by the application. Common connection methods include using a Raspberry Pi or an SSH connection to extract the data.
When beginning to create an adapter, it is important to decide if starting from scratch or modifying an existing adapter from a previous application is the best option. For most cases, an adapter that is already published online could be adapted for the use case. These adapters will be found in many different programming languages for many different devices and applications. This method eliminates the need for proficiency in programming but adds the challenge of understanding what each component is responsible for. One of the best resources for modifying an adapter is MTConnect’s GitHub page. If the best option is creating a new adapter, there are many public resources available on what is needed. MTConnect Institute’s YouTube page is a great resource to find videos on the basics of creating a new adapter. For whichever method you choose, it is important to use the same IP address for the output from the adapter and the input of the agent.
It is also possible to have multiple different adapters that are capable of connecting to one machine. There is no certain way that things must be done when connecting the adapter to the device. Our project began by using Robot Operating System (ROS) to output data from the UR5 robotic arm, but due to conflict with a different design team, our team pivoted to using a Raspberry Pi and the built-in Real-Time Data Exchange (RTDE) program of Universal Robot devices. Many devices have multiple different output methods, and therefore many different adapters can be built to extract and “translate” the data into the MTConnect standard.
Agent
Installing the agent is a very simple process due to the collection of previously designed agents available on the MTconnect Institute GitHub page. The biggest decision that needs to be made prior to selecting the agent is what operating system the agent will be using and what programming language the operator is comfortable with. For our setup, the agent ran on a computer with a Linux setup. The team utilized the C++ agent that had already been written and adapted the .cfg file so that the agent could run on our operating system and connect to the adapter. There are many online guides that are useful in installing an MTConnect agent.
When configuring your agent, the .cfg file will be located in the cppagent directory (if this is the agent you choose). This is the code that needs to be adapted to fit the application. The main sections to change within the .cfg file are the schema and adapter sections. The schema section is where the XML schema for the agent to use is specified. The XML schema is the structure that the data values will be placed in. This will need to be adapted from the .xml file that is located in the directory and will depend on what information is desired in MTConnect. The next section to look at is the adapter section, more specifically the IP address and port. This must be the same as what was specified in the adapter so that the agent knows where to look for the data. If these are different from the adapter, the agent will not receive any information that is outputted from the adapter.
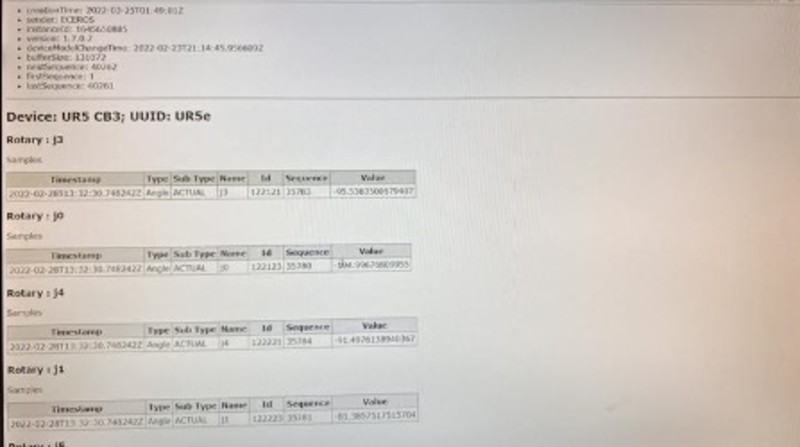
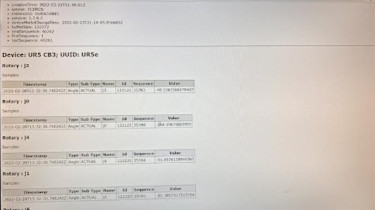
To verify that the agent is running properly, navigate to “localhost:5000” on the device that is running the agent. If the adapter is not outputting, then the agent sections should be displayed on the screen without values. If the adapter is also running, then the values should populate within their respective fields by using data collection commands. This can be done by adding “/sample” or “/current” at the end of the IP address; /sample will return all data points collected by the machine, and /current will show the most recent data points collected. Other HTTP parameters can be used to parse that data further, and resources can be found online with examples.
Application
The application in MTConnect is the system that utilizes the information outputted by the agent. This can vary in complexity and should be customized to each different use. The application could be as simple as a collection of graphs, to as complex as entire software programs analyzing the data. It is important to know exactly what should be accomplished before beginning the application. Many applications work directly with MTConnect, but for those that do not, it is easy to implement a scraper script to add the agent data into a MySQL database that can be used for implementation. This is the method that our team utilized in order to build a Grafana dashboard.
Database
The first step to storing the outputted data is to configure a database. The choice of what database to use and the design depends on the use case. For this project, a MySQL database was set up to store the data into a single table. For more complex data applications or the use of data from multiple machines, multiple tables could be an option. In order to add data into the database, a Python script with the MySQL connector extension was used. This script parsed through the data from the agent, connected to the table in the database, and iteratively added new data points to the table. The table for this application consisted of an auto-incrementing entry id, a timestamp, and six columns for the data from each joint angle. When creating the table in MySQL, it is important to know what data type will be used in each field.
When developing a Python script to parse through the data from the agent and add to the database, it is important to add in criteria that does not continuously add the same data point. In order to do this, adding an “if” statement that is dependent on the change of one of your variables will keep the data unique. A sleep time function is also useful, as it allows for time between the points when the script tries to grab new data from the agent. This ensures that the agent has had time to receive new data since the last ping. With these two functions, the script can be run continuously with the adapter and agent.
Data Visualization
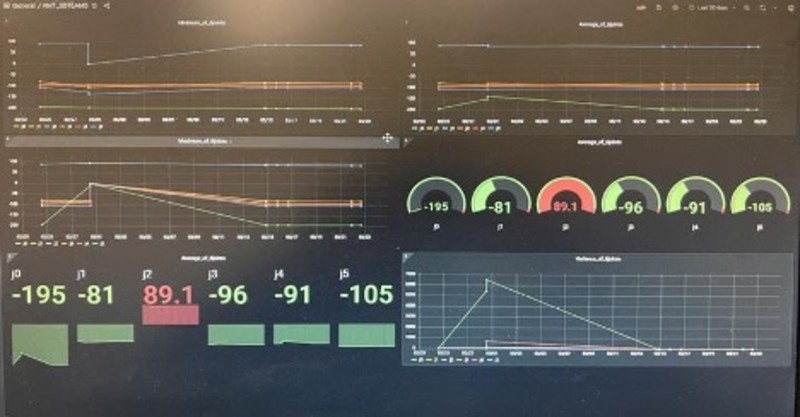
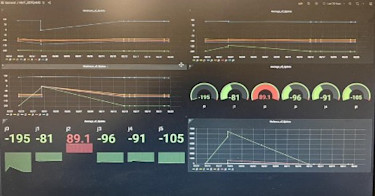
The first step in data visualization is to determine what the priority of the design is and what needs to be highlighted for the use case. This will determine the complexity of data visualization that is needed. For this project, a Grafana dashboard was created to display multiple graphs and metrics of key information. The graphs display how the data varies over time, and some of the metrics are visual cues that the system may be out of place or at dangerous levels. The usefulness of the dashboard is in being able to identify the state of the system with a quick look. For more detailed processes or data analysis, this may not be the most useful form of visualization.
This project uses Grafana to create the dashboard, as it is a free, open-source platform that has many built-in data connection tools. This is not the only option, as dashboard softwares are very common and range in capabilities. There are many free tools available, as well as proprietary softwares that are sold at high price points. The most vital thing to consider when choosing is the compatibility with the rest of the MTConnect system and, more specifically, the data storage from the application. If the visualization software is known prior to starting the use case, then choosing a database that has the capability of connecting is what must be determined.
Creating the Dashboard
For this project, a Grafana dashboard was chosen based on it being a free, open-source platform and its built-in MySQL connection. There are multiple different graph and key performance metric options available that can easily be assembled together on a dashboard. This project utilizes a dashboard that shows the change in data over a period of time as well as snapshot metrics of the maximum and average values for different joint angles. Examples from the dashboard are shown below. If the dashboard is being used as an alert system to show when the system is out of order, limits can be set for variables that then trigger events if they are exceeded. Grafana dashboards also allow for multiple users to create accounts to edit the dashboard from multiple computers. For this project, the Grafana client was installed so that it would run on the local host instead of being accessed from outside of the Learning Factory.
Data Connections
Many open-source dashboards have built-in connection methods for popular data sources. This was the reason that Grafana was chosen for this project, as it had a built-in MySQL connection. The connections available for the dashboard can be found online; this is the page of available connections when working with Grafana. Choosing a dashboard based on the connection methods available is essential. If a connection method is not available, dashboard applications can be designed from scratch but require proficiency in programming. For this project, the connection was available, and using an established dashboard program was more time efficient.
Ensuring that the data connections continuously update is also important. Depending on whether the dashboard is located on an entire network or a singular computer will adjust how to check for new data. For this project, the dashboard is stored on one computer with the database. To check the dashboard connection, navigating to “localhost:3000” will display the dashboard and show changes as new data is added. The addition of new data is important to get timely and accurate measurements for the use case.
Virginia Tech Learning Factory Setup
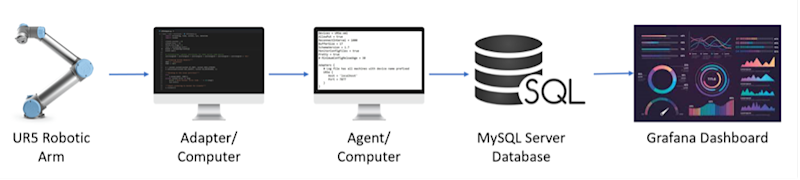
To extract the data from the UR5 robotic arm, we utilized a Raspberry Pi that connects to the UR5 via Ethernet cable. This Raspberry Pi connects to the UR5 using the built-in RTDE code that is used to output data. This is run via a Python script that utilizes the RTDE example library with minor modifications. The information to download the RTDE code directly from Universal Robots can be found on this page. This code extracts the six joint angle positions from the robotic arm and then outputs them in JSON format to the specified IP address on the Learning Factory computer. This was done to avoid running an Ethernet connection across the floor of the Learning Factory from the computer to the UR5 robotic arm.
The computer that receives the JSON-formatted data is also the computer that runs the adapter and agent. The agent Python code then parses through the JSON data from the IP address and converts it into the correct format to feed into the agent. The agent and adapter code communicate via a specified IP address on the host machine. The agent is C++ code that takes the adapted data and organizes it into the specified XML format. This information was then outputted to another IP address on the local network so other devices could connect to it and receive information.
Then a MySQL database was built to store the data that was being reported by the agent. This utilized a Python script to parse the data from the IP address of the agent and connect it to the built database. This was essential due to the MTConnect agent not having built-in storage capabilities. The database allowed for all data to be recorded and utilized for data analysis and the visualization of key metrics. These metrics allowed for optimization of the system by providing accurate and timely information to decision-makers. The MySQL database stored all data from the agent in a single table that included an auto-incrementing entry id, the timestamp, and all joint angle data positions.
The last stage of the Learning Factory setup was the creation of the Grafana dashboard. This is the open-source software that allows the compilation of multiple graphs and visuals into a single dashboard page. Our dashboard included graphs that showed data recorded over time as well as metrics including the maximum and average of certain angles. The dashboard highlights key metrics that can be understood at a glance, allowing for data to be quickly analyzed and for decisions to be made quicker. Grafana is a great option due to being free and easy to use, but there are many other options available that may be better for other use cases.

Future Implications
Industry 4.0
MTConnect directly drives the growth of Industry 4.0 within the manufacturing industry. Its automated data collection, storage, and analysis allow for decisions to be made without complete knowledge of a system. Continuous monitoring allows for this process to also be accelerated, as all the necessary information will be displayed and recorded for future use. Automatic analysis reduces the need for a specialized person to analyze the data. As factories add more machines, a snapshot of the entire production process can be quickly analyzed in one location. With the availability of such information, the process can become more efficient and easily allow for predictive maintenance to be performed.
Amazon Web Services (AWS)
The appeal of AWS with MTConnect is its capability to store collected data within the cloud. Cloud computing is becoming one of the most common data-driven services utilized by industries. By connecting AWS and MTConnect, the data stored from different manufacturing technologies could be accessed from anywhere in the world. This would greatly increase the adoption speed of standards-based manufacturing and allow for more applications with the collected data. AWS is constantly adding new services for users to help in data analytics and security. The flexibility of using cloud computing allows for more efficiency and allows companies to become more agile when handling challenges.
Cybersecurity Considerations
As many more industries move toward data-driven approaches that utilize new technologies such as cloud storage, cybersecurity becomes an important consideration. When collecting data using MTConnect, critical business and process information could be collected that should not be made available to the public. Ensuring that all data collected is protected becomes a challenge that all users will handle in the future.
Advancing the Adoption of MTConnect
As new documentation becomes available for different use cases of MTConnect across different manufacturing processes, the standard’s adoption within industry will increase. Users will see its capability and be able to apply it within their own facility. As more users begin to use MTConnect, new ideas will develop that will further its possibilities. Not only will this advance the adoption within the manufacturing industry, it will also lead to uses in academia and, potentially, research-based organizations.
Lessons Learned and Recommendations
When beginning a project that will implement MTConnect, it is important to understand the machine involved. Completely research the possibilities for connection and understand what data can be extracted. Many machines seem like great opportunities for data collection but will be restricted in what data can be collected and how this data can be extracted. When continuing into the data collection process, it is useful to have multiple alternatives to how the data will be collected. As softwares and machinery change, certain methods used to extract data could become obsolete. Having alternative methods will allow the project team to quickly adapt to these challenges.
Once data is being collected, it is helpful to record the data manually as well as through MTConnect. This provides an easy way to check the accuracy of the process. Data could be recorded differently than what is expected, and the manual data will easily reveal this, as well as allow the root cause to be found. Lastly, continually check to ensure that the process is functioning properly. System resets or updates in technology can mess up the process and may require the process to be adjusted.
FAQ
Why don’t the adapter and agent automatically collect data as the machine becomes operational?
Since the adapter and agent are program files, they will not automatically start when the computer powers on. One way to change this is to use systemd services. This can be programmed into the computer, telling the computer to automatically start a certain process when it is powered on. For this project, we used a systemctl command to start the adapter and agent any time the computer is powered on or restarted. This ensures that the data will always be collected as long as the computer is on. Resources on how to use systemd services are readily available on many software help websites.
Can the MTConnect agent display data recorded within a certain timeframe?
Yes, by using the sample request of the agent. When using the sample request, you can specify the certain data range that is desired. This allows for users to drill down to a certain timestamp and analyze data in smaller groups. This can be specified by adding “?from=” after the sample request to specify the starting point. A count, interval, and heartbeat are all possibilities to specify certain data to be seen.
If I have MTConnect running for a machine, can I add more machines to the same agent in the future?
A benefit of MTConnect is it allows multiple machines to output data to one agent. In order to add a new machine, an adapter will need to be created for the new machine, and a new XML file will need to be created. Then in the .cfg file of the agent, the new adapter and XML will need to be specified. Once this is completed, both machines will communicate with the same agent and allow for the data to be consolidated and displayed in one location.
Team Members
Virginia Tech
Brandon Jacobs
Rodrigo Toriello
Josh Xiong
Peter Liu
AMT
Shaurabh Singh
Documentation and Resources
MTConnect Institute Github:
Previous Design Teams’ GitHub Pages:
https://github.com/mtconnect/vtech_learningfactory_haas_rize1_xrize_adapter
https://github.com/mtconnect/vtech-learningfactory-haas-adapter
Industry 4.0 Information:
https://www.ibm.com/topics/industry-4-0
AWS Information:
https://aws.amazon.com/what-is-aws/
Grafana Dashboard Design and Setup:
https://rigorousthemes.com/blog/best-grafana-dashboard-examples/