Overview
This handbook discusses the technical and developmental aspects of MTConnect as an open-source communication standard. It can be used by anyone but is specifically designed for those seeking to implement and utilize MTConnect in their manufacturing project. It discusses the advantages of MTConnect, offers implementation suggestions, and outlines future implications to guide users in the implementation process and further utilization of MTConnect. This handbook is an expansion upon work done by previous Virginia Tech design teams. The handbooks are found on the AMT page for Virginia Tech use cases.
Introduction to MTConnect
What Is MTConnect?
The open-source MTConnect standard is the product of industry, specifically the consensus-driven Standards Committee of the MTConnect Institute, a subsidiary organization of AMT – The Association For Manufacturing Technology. It provides uniform, structured, contextualized data with no proprietary format, which allows users to implement a streamlined communication standard between machines. This eliminates the need for users to be specialized in any one particular machine software; applications that consume MTConnect data provide more efficient operations, improved production optimization, and increased productivity. Additionally, because scalable system architectures depend on standards, MTConnect provides domain-specific vocabulary and data models, is extensible, and integrates with other standards by design.
MTConnect Advantages
The high-level purpose of this project is to adapt legacy manufacturing technology to be compatible with MTConnect, an open-source data standard. MTConnect streamlines data collection from different machines – for example, the Tormach PCNC 1100 milling center – by linking adapters and agent software to the MTConnect language. The outcome is machine data successfully extracted from an industrial machine or device, stored in a preferred database platform, and visualized on an interactive dashboard. Possible data sources include machine tools, production equipment, sensors, and other machining hardware. This improves operation efficiency, optimizes production, and increases productivity.
Is MTConnect Right for You?
As an open standard, MTConnect is available to any and all manufacturing researchers and engineers. This document will help further identify if MTConnect can accomplish the needs of your project and/or organization.
Reference the MTConnect User’s Portal and other MTConnect documentation for more information.
MTConnect Overview
Requirements for Setting Up MTConnect
Note: This project was built to comply with MTConnect 1.8. There are now more recent versions, including a major update in version 2.0. Please reference the official MTConnect documentation for the most up-to-date information.
Setting up MTConnect in a manufacturing environment requires machines capable of interfacing with an external connection for data extraction. For most legacy machines (those not designed with MTConnect data output in mind), you will need a computer to serve as the external interface to adapt (translate) machine data to the standard. For certain machines running on PC-based software such as LinuxCNC (including the Tormach mill that this project focused on), you can instead develop and install your adapter directly to the machine’s control unit.
You will also need a computer (this time one not attached to a manufacturing machine) to run the MTConnect agent software as a server. This agent will collect data from one or many machines/adapters, allow other computers and programs to access this data, and help to verify that data is being output properly.
The devices involved with the implementation in this handbook include:
Machine: Tormach PCNC 1100 mill (simulated)
Network: Local network with administrative credentials
Server: An Ubuntu Linux-based PC (the MTConnect agent is compatible with any Windows or *NIX PC, including MacOS devices)
Equipment and Devices
“Equipment,” as defined by the MTConnect overview document, is “any data source.” Examples of equipment can include, but are not limited to, “machine tools, ovens, sensor units, workstations, software applications, and bar feeders.”
A “device,” on the other hand, according to the same documentation, is “a piece of equipment or a manufacturing system that produces observations about itself and/or publishes data using the MTConnect Information Model.” Essentially, devices are those pieces of equipment that are capable of exporting their operating data and communicating with the MTConnect agent.
Ensuring that you have some way to interface with your machine is always a good idea. In other words, is it possible to extract data from the machine? If there is no way to extract data from the equipment, then implementing the MTConnect standard would be impractical. In this project’s particular case, the equipment utilized is a Tormach PCNC 1100 milling center; the machine runs on a virtual LinuxCNC controller from a Linux Mint-based computer, so accessing operating data with custom software is fairly simple. Every piece of equipment is different, so be sure to consult the manufacturer’s documentation to see how, or if, you can extract data from the equipment.


Figure 1: An overview of the MTConnect data communication stack. https://www.mtconnect.org/getting-started
Adapter
An “adapter” is software (potentially running on dedicated hardware) that links a device to the MTConnect agent. MTConnect documentation describes the adapter as “an optional piece of hardware or software that transforms information provided by a piece of equipment into a form that can be received by an Agent.”
Its purpose is to extract device-specific data and then act as a “translator” to adapt this data to the MTConnect standard and to stream this information to the agent over a network. Some equipment – particularly modern devices – will not need an adapter at all if they are built with the capability to interact with the agent directly, but devices designed without MTConnect in mind will always require a custom adapter.
Agent
An “agent” is software that collects all the machine data extracted by one or many adapters and collects them in a computer-readable, network-accessible format. MTConnect documentation describes it as “software that collects data published from one or more piece(s) of equipment, organizes that data in a structured manner, and responds to requests for data from client software systems by providing a structured response in the form of a Response Document that is constructed using the semantic data models defined in the Standard.” It functions as a standalone server for hosting the display of information in an XML (extensible markup language) tree on the network.
Application
Whether implementing MTConnect on machines, controls, or any other devices, the standard provides universal data definitions that are always the same, regardless of the manufacturer. This allows any software application to access and consume this data with a certainty of the incoming schema, which makes it easier to build applications for machine monitoring, process analytics, predictive maintenance, and more. Applications can range from custom in-house code to industry standard applications that allow for an MTConnect plug-in or dashboards that display information such as equipment usage and performance.
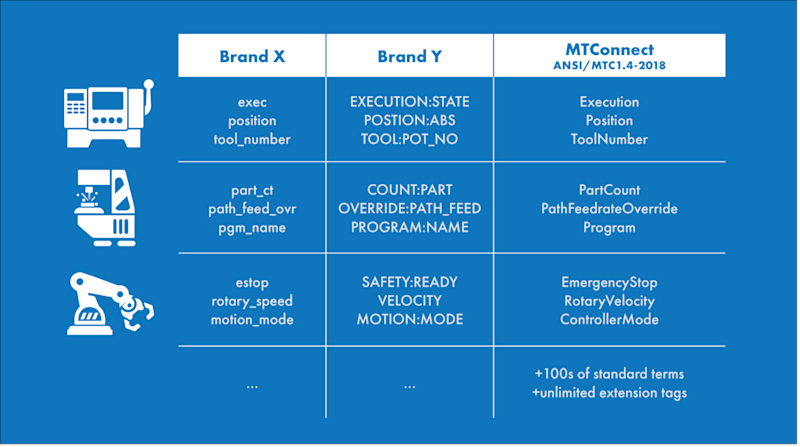
Figure 2: An example of the data translation that the MTConnect standard was designed for. https://www.mtconnect.org
Installing and Configuring the MTConnect Agent
Installation
Installing the MTConnect agent is a fairly simple process, though the exact process depends on whether you are using a Windows or a *nix operating system. The agent files can be easily located on the MTConnect Institute GitHub page, and this project specifically used release version 1.8.0.3. For this project, we tested deployments to both Linux and Windows; the documentation included in each version release should be enough to guide you through the installation process, but if you are struggling with any step, you may find some useful help in this step-by-step installation guide by Machining Code. Once your agent is installed, it will need to be configured properly.
Configuration
Once the agent is installed, you will need to configure the software. Again, the documentation included in each agent release should be enough to guide you through this process, with some potential help from the above-referenced installation guide. The important files to configure are agent.cfg and a devices XML file that you must edit or create in compliance with the MTConnect standard. This XML file defines the data items, components, and controller data that the MTConnect agent should expect to see from each device on the network. For this project, the agent was configured for a single device, and so our devices file was simply named Tormach.xml; this file and our agent configuration are both available on the project GitHub page https://github.com/mtconnect/vtech_learningfactory_tormach_adapter.
Use Case Study: Adapting a Legacy Machine and Leveraging Standardized Data
Introduction and Objective
From September 2022 through April 2023, a team of undergraduate students at Virginia Tech used the campus Learning Factory – a mock industrial shop set up for educational and experimental purposes – to work with AMT and MTConnect on a study in implementing the MTConnect standard and developing a use case for the standard capable of adding real value for industrial organizations. We focused specifically on the Tormach PCNC 1100 milling center, a legacy device with no adapter yet built for MTConnect. At the outset, there was no knowledge of how or even whether internal data could be extracted from this machine or what the internal data schema would look like even if it could be extracted; the team’s work in answering these questions became the cornerstone of this device’s adaptation to the MTConnect standard.
Unfortunately, while Virginia Tech planned to have an operational milling center for the project to investigate, due to unforeseen circumstances, the milling center being investigated was never able to be brought online. Instead, the team performed research on the machine’s documentation, investigated the mostly working and mostly readable operating software on the machine, and developed a simulator to output data similar to an operational Tormach PCNC 1100. The adapter built for this simulated device should be compatible with real hardware after minor adjustments.
Once valid data was collected from our simulator by the MTConnect agent, the team set out to develop a value-add industrial use case for this data and landed on persistent data storage to a time-series database for quality control professionals to identify potential causes of recurring manufacturing issues, as well as a Grafana-based dashboard built for industrial production managers to quickly monitor real-time production metrics and build accurate time-period reports. Both of these tools, as well as our adapter, will be covered in detail in upcoming sections.
Developing an MTConnect Adapter
The first step in building an MTConnect-compliant adapter for any legacy machine, including our Tormach PCNC 1100, is to identify potential ways to extract the machine’s internal operating data and the internal format of said data. Initially, AMT and the Virginia Tech research team expected to be able to investigate an operational milling center, but unfortunately, the Learning Factory (TLF) at VT was not able to bring their mill fully online during the duration of the project. Attempting to get this done ourselves, the team made several fruitless attempts to work with VT electricians, TLF, and Tormach itself to bring the machine online but ultimately shifted gears to a different approach: simulated data.
Simulating the Tormach PCNC 1100
While simulated data was not ideal, the team was able to perform enough research on the machine that the adapter developed for our simulated instance should be fairly easy to modify for a real, operating Tormach mill. Through researching the machine’s documentation and investigating the control unit of our semi-operational machine, it was determined that the mill is run by a virtual LinuxCNC controller on a fairly standard Linux Mint operating system (albeit running on the Linux real-time kernel, which is required for practical applications of LinuxCNC).
The team investigated the standard data schema of LinuxCNC, which includes 87 template variables – many of which represent dictionaries of nested data, resulting in hundreds of potential data items, not all of which are utilized by every LinuxCNC controller. We identified those items that were most likely to be utilized by the Tormach mill, such as “_estop” and “axis,” the latter of which contains nested data for all axes the machine operates on. In an attempt to ensure compatibility with real hardware, the data types and valid values for each simulated LinuxCNC data point were also determined and complied with. This simulator was written as a basic Python script that initializes an empty template of LinuxCNC data, randomizes applicable values, returns the resulting data, and repeats this process on a continuous loop. More technical information can be found through the documentation in our GitHub repository https://github.com/mtconnect/vtech_learningfactory_tormach_adapter.
Adapting Simulated (and Real) Data
With our data simulated to be in the standard format for LinuxCNC, the next step was to write our adapter to translate this into the MTConnect standard.
At the outset of the project, before it was known that the machine was running on Linux, the team needed to determine how data would be extracted from the machine. The initial assumption was that we would be able to extract data through a serial port and would then need separate hardware to run our adapter – perhaps a dedicated Raspberry Pi or a similar microcomputer. Once it was discovered that the machine’s GUI – set up to look like a full custom operating system – was running on top of Linux, the team realized that, theoretically, the adapter could be installed directly to the machine’s control system and translated and export data directly to the MTConnect agent from there. Ultimately, because we needed to simulate our data on a separate PC, we did wind up installing both the simulator and adapter to the same computer.
Note: In a production environment, it may be necessary to install the adapter for the Tormach PCNC 1100 to dedicated hardware regardless. The team could not fully determine whether the mill’s operating computer really had the horsepower to run our adapter in addition to the machine itself; if hardware resources are an issue in practice, then it would be best to install a very simple script to the Tormach’s operating system that only accesses LinuxCNC data and exports it over the network to another PC and to install the adapter there to translate the exported data and to communicate with the MTConnect agent.
Simulated vs. Real Hardware Compatibility: For the purposes of this project, the adapter that the team developed is a Python module that accesses data by simply importing our simulator module and running the method to initialize and randomize relevant LinuxCNC data. In a production environment, this adapter would need to instead be configured to listen to the port defined in the LinuxCNC configuration files to gather data; for more context and an example of an existing adapter for a LinuxCNC-based machine, refer to the MTConnect PocketNC milling machine adapter.
With the machine or simulator’s data successfully imported, the adapter now combs through the data in a Python dictionary format; translates each value to its MTConnect equivalent, e.g., converting “_estop” to “EMERGENCY_STOP” and converting the LinuxCNC integer values of 0 and 1 to the MTConnect values “ARMED” and “TRIGGERED”; and then sends an update on any data that has changed since the last check to the MTConnect agent.
Developing a Practical Use Case
The next subject of interest for the project team was to determine how this MTConnect standardized data, and potentially data collected from several devices at once, could be useful to industry professionals and organizations. Initially, the team considered building an operational readout to visualize the machine’s operations on a kiosk for machine operators. Ultimately, however, it was determined that the Tormach mill’s built-in GUI, as with most manufacturing machines, simply does a better job of this than a custom kiosk likely could, and without a guarantee of the LinuxCNC data items that are actually utilized by the mill, creating a dashboard to display them would be like grasping at straws and would most likely result in very little usable work for the industry.
Instead, the team took a step back and looked at the bigger picture, considering other stakeholders in the industrial environment. We decided to build two prototype software products: first, a time-series database for persistent storage of MTConnect data samples so that quality assurance professionals facing recurring production issues can investigate past operational data to look for patterns that may be creating these recurring problems. Second, a simple dashboard intended for shop production managers that aggregates data across an entire fleet of machinery and gives these production managers the capability to monitor the general status and productivity level of their entire shop at a glance at any time, as well as monitor more specific metrics for specific machines or easily build accurate time-period production reports. Both of these prototypes are completely functional on a proof-of-concept level and extensively documented in the project GitHub repository to allow for customization and extension by other developers.
Storing MTConnect History in a MongoDB Database
To complete the first component in our use case, the team needed to determine a reasonable database technology for storing time-series records. SQL and other relational databases were immediately disregarded, as document databases seemed to be much better suited for the job. The team considered using InfluxDB, as it was built specifically for time-series records, but ultimately chose to implement MongoDB for better compatibility with other applications and because of better general familiarity with the software on the team. It was also chosen because the team intended to use MongoDB Charts as visualization software for our dashboard, though that did later experience a change, of course.
In the project GitHub repository, you will find a folder named “Database Link” containing a Python script and an extensive readme file. This Python script queries the MTConnect agent over HTTP, performs a few structural transformations on the data for compatibility and legibility in MongoDB, and then stores this data as a new time-series record in the database. In order to deploy this link, you will need to first set up a MongoDB Atlas account or local installation.
This project utilized MongoDB’s cloud-hosting solution, Atlas, in order to limit hosting and network issues and accelerate setup. The software developed by the team will require minor modifications in order to work with a local installation of MongoDB. The steps that follow are specific to the cloud-hosted nature of our implementation.
After setting up an account in MongoDB Atlas and launching a new database, the database_link.py Python script can be configured with global variables in the first few lines of code for:
The connection string to your database; you can get this from MongoDB Atlas or your local installation of MongoDB
A username and password; you can set up credentials in MongoDB specifically for this software rather than using a real user’s credentials
The database and collection names to store records to; you do not need to instantiate a collection before running the software – if the collection is not found, one will automatically be created
The interval (in seconds) over which to add new data samples to the database
With these configured correctly, the database link will begin collecting data from the MTConnect agent and storing persistent records to MongoDB, which can be projected, aggregated, and investigated for points of interest later by any engineer familiar with MongoDB’s query language.
Note: Since the completion of this project, it has been determined that HTTP Get requests are not the most efficient way to collect data from the MTConnect agent, and future implementations of this database link should be modified to account for this. See “Lessons Learned” for more information.
Extending MTConnect Data From MongoDB: Building a Visual Dashboard
With our persistent storage working and forensic analysts on quality control teams satisfied, our next goal was to aggregate this data in a useful way on a visual dashboard. We intended to build a prototype dashboard that might be useful on the wall in a production manager’s office on a large manufacturing floor – something capable of aggregating and displaying machine statuses and productivity metrics across an entire fleet of machinery while also capable of digging into more detailed metrics for specified machines.
Initially, the intent was to use MongoDB Charts for this purpose, based on a high level of assumed compatibility and ease of integration with MongoDB and perfunctory research suggesting that the tool would be a good choice for time-series visualizations. Unfortunately, we discovered during development that this was simply not the case; MongoDB Charts is excellent at aggregating data over a time-series of records and displaying calculated outputs in many visually interesting and helpful ways, but it is quite terrible at simply displaying real-time data from the most recent records in a dynamic time-series database.
For this reason, we shifted development toward Grafana. As with MongoDB, we used Grafana’s cloud-based web app to build our dashboard in order to accelerate setup and limit infrastructural issues. Our work should be compatible with local instances of Grafana, but this has not been tested.
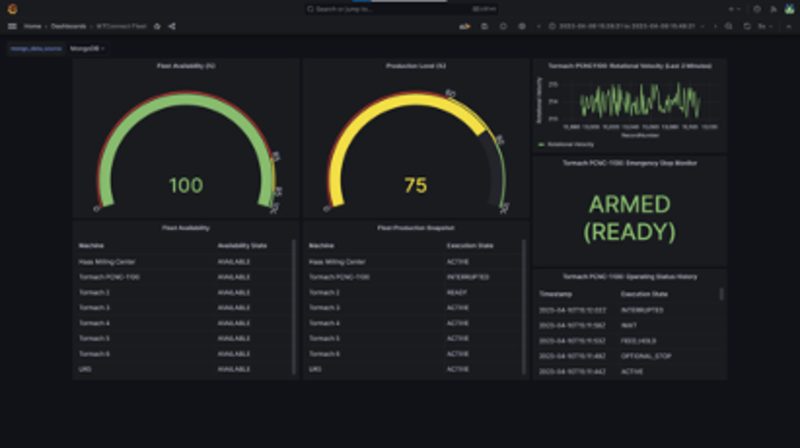
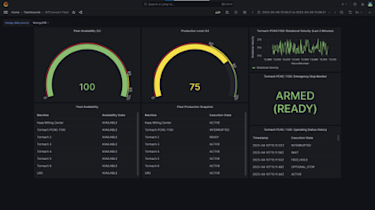
Figure 3: A sample screenshot of the Grafana dashboard developed for MTConnect-equipped machine shops.
The sample dashboard above can be looked at in three columns, where the first two are focused on an industrial shop as a whole, and the last is focused on a specific machine. In the database this dashboard was built on, we simulated simple “availability” and “execution” status data for several additional manufacturing machines to demonstrate how MongoDB and Grafana could be used to look at universal MTConnect device data items like these across an entire industrial shop.
In the first column, we look at fleet availability. In MTConnect, “availability” is a simple measure of whether the MTConnect agent is currently capable of seeing and receiving data from the relevant device. At the top, we’ve provided a gauge that measures this statistic across all devices listed by the agent and added thresholds to color-code our data based on performance. It’s expected that machines should never be “unavailable” if they and their MTConnect adapters are running properly, so the gauge will turn yellow below a threshold of 95% and immediately turn red below 85% to alert managers to a disconnection issue. These values are parameterized and easy for end users to adjust with the documentation included in our repository, as are most other values we’ll discuss. Below the gauge, you can see a scrollable chart readout that can be sorted by either machine name or availability status so that one may quickly identify which machine is throwing errors when a problem anywhere in the fleet occurs.
In the second column, we look at fleet productivity levels. This was calculated as the number of machines that are currently in the “EXECUTION: ACTIVE” state, the only MTConnect execution value that represents active work on a part, divided by the total number of machines reported by the MTConnect agent. Again, red and yellow thresholds are easy for the user to adjust based on their shop’s production targets. Below, the chart again prints the execution state for every device reported by the agent so that current operations can be determined at a glance.
In the final column, we dig a bit deeper into a specific machine: our simulated Tormach PCNC 1100. At the top, we print a readout of the machine’s spindle speed over the last two minutes; this is ultimately just a demonstration and example of how any numeric MTConnect data item can be tracked over time with minor adjustments and is limited only by the imagination of implementation teams at various industrial organizations. In the next panel down, we have a simple readout of the current value for a non-numeric data item; in this case, emergency stop status. The tag “(READY)” was added to the MTConnect-standard “ARMED” to add clarity for less technical users and a change to “TRIGGERED” will also change the panel to bright red. Based on Grafana documentation, it is possible to link a panel like this to physical lights or sirens, allowing for real alarms to go off immediately when certain values are encountered. Finally, in the last panel, we look at a time-stamped history of execution states on the machine over the last several minutes; this example of a semi-persistent visualization of non-numeric data is again limited only by future implementers of this work.
This sample dashboard was exported as a JSON model and saved to our GitHub repository and can quickly be launched from this JSON model to any Grafana instance. In our GitHub documentation, we include instructions for this process, comments on reconfiguring the dashboard for your own purposes (wherever possible, items such as the data source (a Grafana object), the database name, the collection name, and performance metric thresholds were parameterized and made easily reconfigurable), extensive technical documentation on the development and functionality of the sample panels, and a tutorial to create your own panel and add it to the dashboard. This new panel looks at and reports data over the last seven days or any particular period the user specifies, narrows it down to focus on one device, and prints values for each execution state as a percentage of the total time the device has spent in that state. Through this process, end users can easily generate weekly, monthly, or annual reports for utilization on a single machine or for general productivity metrics across an entire shop floor.
The Value of a Production Dashboard
The ease of launching and extending this dashboard allows for several benefits to industrial manufacturing organizations:
Organizations that are focused on safety and consistency initiatives can implement alarms and reactive processes to such events as an e-stop being triggered as discussed above.
Organizations that are focused on lean production initiatives can use the availability and productivity aggregate visualizations to easily identify equipment that is either problematic to run or underutilized and target this equipment to be sold off or otherwise removed from the production floor.
Production managers can use dashboard panels to quickly and dynamically generate accurate production reports, allowing for data-driven decisions to be made around productivity, personnel, purchasing and acquisitions, and more.
Future Implications and Lessons Learned
Overall, we feel that this was a successful project, resulting in the following:
An MTConnect adapter for a simulated Tormach PCNC 1100, which can be easily modified to work with a real milling center by anyone with a working mill
A persistent-storage database extension for any deployment of the MTConnect agent, regardless of specific devices, that can help to find causes of recurring production issues
A visual dashboard for any deployment of the MTConnect agent, regardless of specific devices, that can help to keep an eye on productivity, identify network and software issues, display real-time statistics, and generate accurate time-period reports for production environments
With more time to continue our work, there is one major change we would make to the database link component: as mentioned previously, we have since learned that HTTP Get requests are not the most efficient way to get data from the MTConnect agent, and would instead recommend configuring a socket between the agent and the database link script so that the agent can automatically send new data only when it has experienced a change. This process is documented in the MTConnect standard. Our other recommendations to project teams setting out on similar initiatives include the following:
Perform as much paper research as possible. Quite often, the answers to questions or problems that we scratched our heads on were plain to see in the documentation for MTConnect, LinuxCNC, MongoDB, and Grafana, but a lack of familiarity with these documents and some anxiety over their density led to wasted time experimenting rather than reading. Read the docs.
Look for similar projects. Even though we could not functionally operate our Tormach mill, it was through finding the MTConnect adapter for the PocketNC mill that we were able to increase the confidence of compatibility with real hardware and provide theoretical instructions to modify our work for such. Often, there is existing work that can and will accelerate your development process; however, make sure to examine any resources like this carefully for mistakes and errors before implementing them yourself.
Don’t attempt to use MongoDB Charts for real-time readouts – at least not with the current version (as of April 2023). The documentation does suggest this purpose, but Grafana is quite simply a better, more customizable, and more parameterizable tool.
As for future implications of our work, there is truly no limit. Being forced to work with an inoperative Tormach mill was a blessing in disguise, as we were pushed away from machine-specific visualizations and focused instead on tools that could be useful for any MTConnect-compatible production shop. We’ve provided several real potential use cases for our dashboard, but with the documentation on each of our sample panels as well as the tutorial for creating your own time-period reports in Grafana based on any data metric, there is truly no limit to how far future implementations might extend our work. We’re excited by how far it could potentially go!
Team Members
Virginia Tech
Jayce Barillaro
Nick Swanson
Sanam Patel
Santiago Sun
AMT
Shaurabh Singh

